LOOKUP Built-in Allows Reuse of Graphical Function Curves
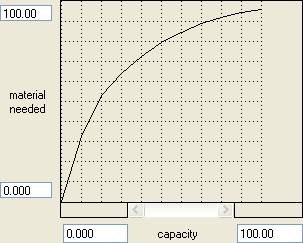
Sometimes it is necessary to access a data set from multiple places within a model. For example, a manufacturer may have a non-linear curve that maps capacity required for a given product to raw material required to manufacture it. Such a curve is shown below:

If one production line needs to know this information, a graphical function works fine. However, if there are two production lines in the model, the second line also needs this information. If the two lines are identical in structure, the model could be arrayed to share the curve for both lines. If they are not, it was necessary in versions prior to 9.1 to make a copy of this curve for the second production line. Then if, at a later time, one copy of the curve needed to be changed, the other one also needed to be changed in the same way.
Version 9.1 introduced the LOOKUP built-in. This allows any graphical function curve to be re-used as many times as desired within the same model. Note that a graphical function, by definition, ties a specific equation to the given curve. Using LOOKUP, it is now possible to evaluate that same curve using several different equations in the same time step.
In this case, let’s assume the second production line has similar variables with “2” appended to their names. Thus, there is a capacity2 and a material needed 2. Prior to version 9.1, it was necessary for material needed 2 to be an identical copy of material needed.
Since version 9.1 allows the curve to be re-evaluated for any arbitrary
expression, material needed 2 no longer needs to be a graphical function.
Instead, it contains the equation:
- material_needed_2 = LOOKUP(material_needed, capacity_2)
This equation simply evaluates the graphical function stored in material needed using capacity 2 as the x-coordinat