LOOKUPXY Built-in Increases Dataset Flexibility
Version 9.1.2 adds the ability to incorporate non-regularly sampled data easily into your models. Many people use the graphical function for historical records of data. The graphical function, however, assumes a fixed interval along the x-axis. This can make it difficult to use data like the following:
| Day | Flow |
|---|---|
| 1 | 12.1 |
| 3 | 7.6 |
| 4 | 15.2 |
| 6 | 13.5 |
| 9 | 23.8 |
| 12 | 17.3 |
While it is easy to determine the fixed interval to use to capture all of these points (1 day), it is more difficult to determine what data points to use for the missing intermediate 1-day values. There are also many cases where it is very difficult to find a fixed interval that works for a given dataset.

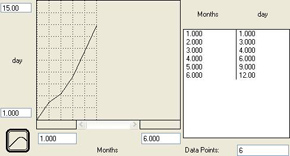
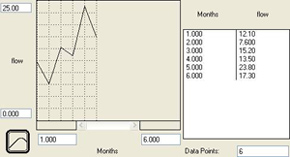
The LOOKUPXY built-in was specifically added to address this issue. It is unique in that it requires two separate graphical functions: one for the x-coordinates of each pair and one for the y-coordinates of each pair. The number of points in each graphical function should match; if they do not, extraneous points are ignored. The data values (x-coordinates and y-coordinates) are both entered by the user as the y-values in each graphical function. The x-values in each graphical function are ignored; only the number of points matter. It is a good idea, though, to run the x-axis of both from one to the number of points. That way, it is easy to verify that the values in each graphical function properly align with one another. In addition, the x-coordinates should be in increasing order. If they are not, however, the program will automatically readjust them when the model is first run.

The data above are entered into two graphical functions day and flow as shown at the right. Note the equation for each graphical function is also unimportant. It is always safe to use TIME (the default when you press “Become Graphical Function”).
The model is very simple:

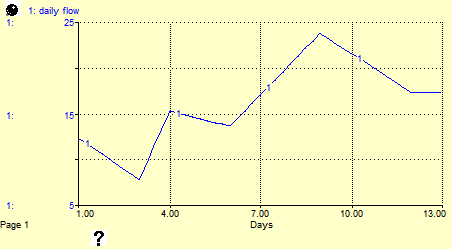
The following equation for daily flow retrieves this data over the course of the simulation (topping out at 17.3 after time 12):
- daily_flow = LOOKUPXY(day, flow, TIME)
Note the graphical function for the x-coordinates is given before the graphical function for the y-coordinates. In addition, the graph of daily flow is necessarily different from what appears in the graphical function flow, which has the data points drawn at a fixed interval.

As with the graphical function, linear interpolation is used between the given points and out-of-range x-values evaluate to either the first or last y-coordinate, depending whether the value is below the minimum x-coordinate or above the maximum x-coordinate, respectively. The discrete option is also available. Make sure to set it in the variable containing the y-coordinates. [Note that setting it in the variable containing the x-coordinates merely serves to drop the last point.]