We have met an ally and he is Storytelling
Editor’s note: This is a guest post by isee’s consulting & training partner Chris Soderquist
Background
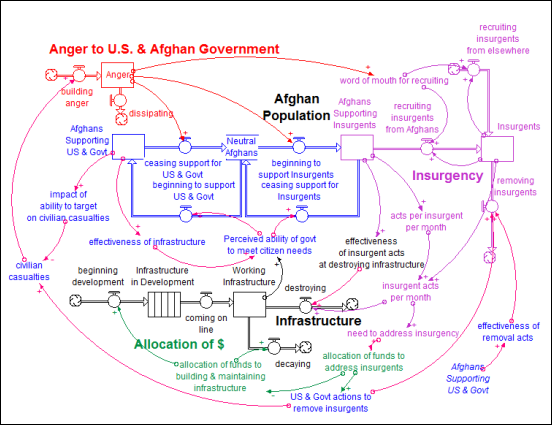
 The April 26, 2010 article in the New York Times titled “We have met the enemy and he is PowerPoint” has created quite a stir. It is particularly telling that three days after its publication, it is the most emailed article on their website! The most interesting aspect of the article to me, as a system dynamics practitioner, is the publication of a system dynamics map on the US Counter-insurgency strategy as the example (i.e. visual sound bite) demonstrating why PowerPoint is so problematic. This is actually a poor example of the author’s point, since it is not PowerPoint, and because the map was shown out of context.
Although the diagram doesn’t portray how or why PowerPoint is misused, it does demonstrate some reasons why system dynamics maps and models are not more broadly used to communicate systemic issues. In this post, I will describe what issues a PowerPoint paradigm creates and how system dynamics can address those issues; more importantly, I will show why the STELLA and iThink software have features such as storytelling and web publishing in order to help people develop deeper, more systemic understanding of the complex problems humanity must address.
The Problem with PowerPoint
I don’t have anything against using PowerPoint. Those of you who have taken one of my webinars for isee systems know that I rely heavily on the software in my instruction and facilitation. I think there are inherent software limitations that combine with a cultural paradigm, that lead to its misuse. Currently, I see it promotes the following approaches to problem solving:
- Narrow focus in space and time – due to limited screen real estate
- Passive absorption of information of data – lazy learning, not experiential
- Simplistic bullet point thinking – linear thinking, focusing on factors in a non-operational way
 This all creates confusion between reducing complication and simplifying complexity. The world is a dynamically complex place, and thank goodness for that! Picture the blandness of a world that is simple, where everyone thought and acted the same, where you always knew exactly what would happen because it was so simple. Boring! On the other hand, dynamic complexity makes it difficult to resolve what currently appear to be intractable problems, such as environmental degradation, poverty, global economic turmoil. Living in a dynamically complex world necessitates finding ways to simplify complexity to its essence, making manageable and useful mental models.
That’s why people are drawn to lists (e.g., bullet point and linear thinking), believing it simplifies complexity; just give me a list of what’s wrong or what to do! What lists do well is remove complication, but they also remove the dynamic essence of reality, often making mental models that are less than useful.
System dynamics
System dynamics is an approach to building understanding that expands boundaries, looks at the world as comprised of feedback loops, uses a visual language that promotes operational thinking, and creates active learning. It’s a terrific approach to counter the many problems inherent in applying PowerPoint paradigm!
All of the above helps develop useful mental models that are both simplified and still capture the essence of reality. However, taking a map out of context – even one much simpler than shown in the article – and including it in PowerPoint will not create understanding, only confusion! When I’m in front of a group and have enough time, I will always draw it up on a flipchart or board, to bring the group along with its unfolding. The rapid feedback creates an engaged group capable of learning. But in the absence of time, or if you need to communicate to people “on their own time” you will find features in STELLA and iThink invaluable!
I’ve published a map to the web with the isee NetSim software to demonstrate how you can use system dynamics to create online experiential learning labs. Take a tour of the map below to see how the stock/flow language and Storytelling can overcome the passive absorption of bulletized information that PowerPoint facilitates.
Click on the image below to make sense of the map
Another interesting perspective from Linda Booth Sweeney on the New York Times article can be found on her blog.
