New ARRAYRANK Builtin Sorts Array Values
Version 9.1.2 will introduce the ARRAYRANK feature. Here is a preview of its capabilities.
The ARRAYRANK built-in can be very powerful for some applications. It allows you to order the values in an array from smallest to largest or vice-versa. In this sense, it expands upon what ARRAYMINIDX (find the index of the smallest value) and ARRAYMAXIDX (find the index of the largest value) already do.
To introduce ARRAYRANK, let’s look at a simple model that uses it. In this model, we explore the efficacy of applying tiered commissions for salespeople in an effort to encourage them to sell more. Each tier is designed as a reward so the top seller in any given week gets the highest percentage, while those who do not perform will get the lowest. The tiers are:
Top seller: 20%
2nd best seller: 15%
3rd best seller: 10%
Everyone else: 5%
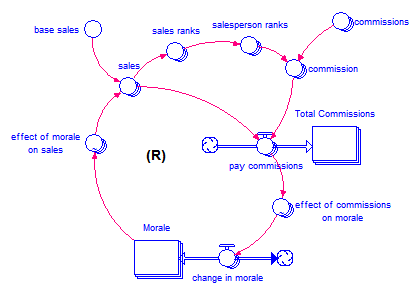
Note that the non-tiered system gave everyone 10%. The model is very simple:

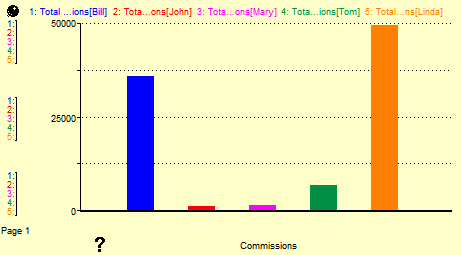
As a person’s sales go up, they are paid a higher commission, their morale gets a boost, and they then sell more. This is a virtuous cycle. However, as a person’s sales go down, their morale falters, and they sell less. This is a vicious cycle. Note that all salespeople start at exactly the same level of morale and, hence, sales. Observe what happens under the new policy:

It is interesting that within a very short period of time (the simulation runs for one quarter), two people dominate both sales and therefore commissions. Will this really improve overall sales? Open the attached model to explore the behavior further (arrayrank-example)
The key variables that make this work are sales ranks, salesperson ranks, and commission. Their equations, which are applied to all array elements, are:
sales_ranks = ARRAYRANK(sales[*], ARRAYIDX())

salesperson_ranks = ARRAYRANK(sales_ranks[*], DIMSIZE() - ARRAYIDX() + 1)

commission = ARRAYVALUE(commissions[*], salesperson_ranks[Salesperson])
ARRAYRANK takes two parameters, the array to rank and which rank is desired. It evaluates to the index of the element with that ordinal rank from smallest to largest (i.e, in ascending order). The rank must be between one and the size of the array. For example,
ARRAYRANK(sales[*], 2)
gives the index of the 2nd smallest element of array sales. Thus, the formula for sales ranks places the index of the lowest sales figure into its first element, the index of the second lowest sales figure into its second element, and so on up to the index of the highest sales figures in element DIMSIZE(). [Note that ARRAYIDX() in an apply-to-all equation is equal to the numerical index of a given element running from one to DIMSIZE().]
Note, however, that sales ranks does not contain the desired salesperson ranks themselves, which we need to calculate the commissions. E.g., it does not tell us that the first salesperson is ranked 3rd. Rather, it contains the indices of the ranked sales figures. If we examine ARRAYVALUE(sales[*], sales_ranks[1]), we will get the smallest sales figure. How can we get the salesperson ranks? Let’s examine this in more detail.
Imagine the sales figures are 2000, 4000, 5000, 3000. ARRAYRANK on this dataset will return 1, 4, 2, 3. Using these numbers, we can easily extract the sales figures in ranked order. But what we really want is the sequence 4, 2, 1, 3. This sequence tells us that salesperson one had the 4th highest sales, salesperson two had the 2nd highest sales, salesperson three had the highest sales, and salesperson four had the 3rd highest sales. This allows us to directly extract the commission percentage. To convert the rankings of sales back to the rankings of the salespersons, we only have to sort the sales rankings. That is what the equation for salesperson ranks does.
Since we also want the highest, rather than the lowest, sales figure to be ranked one, we do the sort in descending order. Instead of using ARRAYIDX() for the desired rank, this equation uses DIMSIZE() – ARRAYIDX() + 1, which reverses the rankings. While ARRAYIDX() counts from one to DIMSIZE() as the array index increases, DIMSIZE() – ARRAYIDX() + 1 counts down from DIMSIZE() to one, reversing the ranks.
Finally, the commission is directly extracted from a table of commissions (stored in an array) using ARRAYVALUE and the salesperson rank. Note that the array commissions has as many entries as there are salespersons, starts with the highest commission (0.20), and ends with the lowest (0.05).