Tip: Setting up imports for 2D Graphical Functions
iThink and STELLA version 9.0 introduced a powerful new feature: data import and export with Excel. Here at isee, we were excited to hear from our customers about how much they appreciated the feature and how easy it was to use. In fact, many customers told us that it was the major reason they upgraded to version 9.0
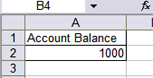
Setting up a data import from Excel is pretty straight forward: type the name of the model variable in one cell, type the value you want to import in the cell below it, (or beside it if you are using horizontal orientation):
If you are importing a time series or graphical function, you just keep listing the data points in the cells below the variable name:
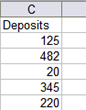
This kind of data formatting works well since an Excel sheet is made up of columns and rows. But how do you format data that is harder to visualize? Things get a little tricky when you start dealing with arrayed variables. The most complex import is a 2 dimensional array of graphical functions. It’s actually 3 dimensions!
I’ve put together a simple example to illustrate how to do this.