Skip to content

Making Connections

isee systems blog

Making Connections

  • About
  • More Connections
Search

Drifting Goals

Updated: March 11, 2016March 9, 2016Filed under: Systems Thinking1 Comment

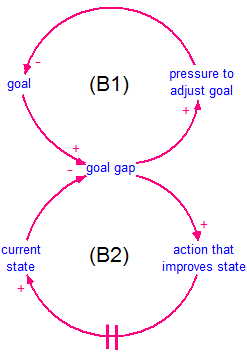
The Drifting Goals Archetype applies to situations where short-term solutions lead to the deterioration of long-term goals.  Also known as Eroding Goals, this is a special case of Shifting the Burden.  This Systems Archetype was formally identified in Appendix 2 of The Fifth Discipline by Peter Senge (1990).  The Causal Loop Diagram (CLD) is shown below.
image

When a gap exists between the current state of the system and our goal (or desired state), we take action proportional to the gap to move the system state toward our goal.  There is always a delay between the action we take and the effect on the system.  Simultaneously, pressure is exerted to instead adjust the goal to close the gap.  Adjusting the goal leads to a situation where the goal floats independently of any standard.  It often leads to goals being reduced, or eroded.

Classic examples of drifting goals include:

  • Reducing quality targets to improve measured quality performance (relative to goal) or to improve delivery schedule
  • Reducing quality of ingredients or parts below company standards to improve profits
  • Increasing time to deliver to match existing capacity and save on overtime
  • Reducing a new product’s feature set to meet deadlines; this works the other way also, i.e., extending the deadline to include all of the features
  • Reducing pollution targets when reduction implementation costs are too high
  • Increasing budget deficit limits rather than decreasing spending (or increasing taxes)
  • Adapting to unacceptable social circumstances rather than leave that environment
  • Reducing entrance requirements because not enough applicants meet them
  • Reducing level of patient care below recommended minimum due to understaffing
  • Reducing margin to spur sales and meet revenue targets
  • Lowering your own expectations in life, leading to lower personal success

Note that in many of these cases, there are competing goals and one is held more sacred than another.  Drifting Goals is an insidious process that seeks to lower your standards to the level of the current state of the system.  Stay aware of not just how the state of the system adjusts to your goal, but also of how your goal varies over time.  Changing a goal should be a conscious decision that does not undermine other objectives.
(more…)

Systems Thinking
  • archetypes
  • Causal Loop
  • CLD
  • Systems Thinking
1 Comment

System Dynamics Conference in Cambridge, MA

Updated: August 10, 2015August 7, 2015Filed under: News & Announcements15 Comments

The 33rd International System Dynamics Conference (ISDC) was an inspiring event and we met many new faces as well as many longtime friends! If you were not able to attend the ISDC, stop by our booth, or go to the workshops on Thursday, we documented some of the highlights for you. isee systems was once …

Keep Reading
News & Announcements
  • Barry Richmond
  • conferences
  • scholarship
  • System Dynamics Society
  • workshop
15 Comments

Generating Random Numbers from Custom Probability Distributions

Updated: November 1, 2017May 29, 2014Filed under: Modeling Tips
  • STELLA & iThink
4 Comments

STELLA® and iThink® provide many useful probability distribution functions (listed here).  However, sometimes you need to draw random numbers from a different probability distribution, perhaps one you have developed yourself.  In these cases, it is possible to invert the cumulative probability distribution and use a uniformly distributed random number between zero and one (using the RANDOM built-in) to draw a number from the intended distribution.  With a lot of math, this can be done analytically (briefly described here).  With no math at all, it can be closely approximated using the graphical function.

Find the Cumulative Distribution Function

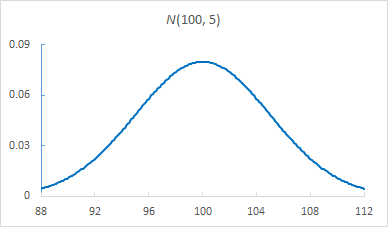
Every probability distribution has a probability density function (PDF) that relates a value with its probability of occurring.  The most famous continuous PDF is the bell curve for the normal distribution:

image

From the PDF, we can see that the probability of randomly drawing 100 is just under 0.09 while the probability of randomly drawing 88 or 112 is close to zero.  Note that applying the techniques described in this article to a continuous probability distribution will only approximate that distribution.  The accuracy of the approximation will be determined by the number of data points included in the graphical function.

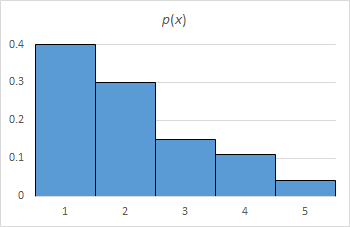
For discrete probability functions, the PDF resembles a histogram:

image

From this PDF, we can see that the probability of randomly drawing 1 is 0.4, while the probability of drawing 3 is 0.15.  As discrete probability distributions can be represented exactly within graphical functions, the remainder of this article will focus on them.

(more…)

Modeling Tips, STELLA & iThink
  • builtins
  • distributions
  • graphical function
  • iThink/STELLA
  • probability
4 Comments

Posts pagination

  • Previous
  • 1
  • 2
  • 3
  • 4
  • 5
  • 6
  • …
  • 29
  • Next

Categories

  • Education (4)
  • isee NetSim (3)
  • isee.NET Framework (1)
  • Modeling Tips (32)
  • News & Announcements (17)
  • STELLA & iThink (15)
  • Stories from the Field (5)
  • Systems Thinking (8)
  • Training (6)

Archives

Browse by keyword

2D array archetypes arrays Barry Richmond Bass diffusion builtins calibration Causal Loop CLD command line conferences crisis data diffusion Education environment export game graphical function h1n1 healthcare housing import iThink/STELLA market dynamics MODSIM modules mortgage netsim optimization Physics policy price releases scholarship software spatial Stella storytelling System Dynamics Society Systems Thinking Version 9.1.2 video webinar workshop

Recent Posts

  • Merlin: Extending the Craft for Experienced System Dynamics Modelers in Stella® Architect 4.3 July 1, 2026
  • Socrates: Lowering the Barrier for Newcomers to System Dynamics in Stella® Architect 4.3 June 18, 2026
  • COVID-19: Modeling Distributions of Incubation and Recovery Times April 1, 2020
  • Multiobjective Optimization January 9, 2018
  • Optimizing Model Performance December 22, 2017

RSS System Dynamics Forum

Recent Comments

  • best apps review on About
  • digital software on Modeling the Economic Crisis
  • Mishawaka Indiana on What are “Mental Models”?
  • La Paz Indiana on XMILE – An open standard for system dynamics models
  • Bristol Indiana on Modeling the Economic Crisis

Meta

  • Log in
  • Entries feed
  • Comments feed
  • WordPress.org
Products
Software (v1.3)
  • Stella Architect
  • Stella Professional
  • Stella Designer
  • Stella Simulator
  • iThink
  • Feature Updates
  • Policies
  • Publishing Options
  • License Agreement
Free Software
  • Stella Online
  • isee Player
  • Stella Architect Trial
Solutions
Consulting
  • Systems Innovation Practice
Common Applications
  • Business
  • Education
  • Research
  • Government
  • Energy
  • Health
  • Agriculture
  • Manufacturing
  • Conservation
Quick Links
About
  • isee systems
  • Systems Thinking
  • Barry Richmond Scholarship
Resources
  • Frequently Asked Questions
  • Product Help
  • Examples
  • Request Support
  • Request Quote
  • Systems in Focus
  • Quick Tips
  • Legacy Tutorials
News and Events
Upcoming Workshops
  • Introduction to Dynamic Modeling
  • Whole Systems Partnership
Newsletter
  • The Connector
Recent Webinars
  • Model Mysteries
Recent Training
  • Systems Thinking Practice
Press Release
  • Stella Architect Release

  Phone: (603) 448-4990   Email: info@iseesystems.com

   Monday - Friday: 9:00 am - 5:00 pm EDT | Saturday - Sunday: Closed
Wheelock Office Park | 31 Old Etna Rd, Suite 7N | Lebanon, NH 03766 | US

isee systems inc. holds registered trademark rights over the following: iThink®, STELLA®, Stella®, isee systems® and claims the following trademarks; isee NetSim™, Stella Live™, Causal Lens™ and Stella Online™.

Terms of Use

© 2017. isee systems inc . All rights reserved.