Modeling Customers Switching Between Brands
This is the third installment of a four-part series. The other three parts can be accessed by clicking on the links below.
Methods for Using Arrays Effectively
Modeling a Watershed with Arrays
Modeling Customers Switching Between Brands – The General Case
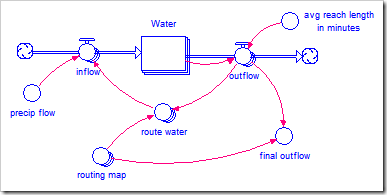
In the second post of this series, I showed how to selectively pull information from an array in order to route water through a watershed. In this post, I will use the exact same technique to move customers between different product brands.
Switching Customers between Different Products
Business models often need to model gaining customers from, and losing customers to, competing products in a relatively mature market (what Kim Warren, in his excellent book Strategy Management Dynamics, calls “Type 2 Rivalry”). These are often driven with statistical models developed through market research. For this application, we need a matrix describing the probability of switching from product A to product B each time unit. A sample appears in the table below.
| From\To | A | B | C | D | E |
| A | 0.000 | 0.010 | 0.030 | 0.050 | 0.001 |
| B | 0.030 | 0.000 | 0.050 | 0.070 | 0.020 |
| C | 0.010 | 0.001 | 0.000 | 0.020 | 0.015 |
| D | 0.001 | 0.000 | 0.020 | 0.000 | 0.005 |
| E | 0.001 | 0.005 | 0.020 | 0.045 | 0.000 |
switching probability (units: dimensionless)
To read this table, locate the product the customer is presently using in the left column (say, B). Read across that row (the second row, in this case) until you find the product the customer is switching to (say, C). The number in that cell (in this case, 0.05 or 5%) is the probability the customer will switch from the first product to the second (from B to C) in this time unit. If the model is running in months, as ours is, this table indicates that 5% of customers using product B switch to product C every month.
Of course, the values in the table do not need to be constant. Often each cell will contain a regression equation based on various product characteristics – including market share, marketing effort, product features, and product quality – that evolve over the course of the simulation.
Note the diagonal is zero. This means customers do not switch from one product to the same product.
Note also that the sum in any row cannot exceed 1.0, which represents 100% of the customers using that product. It is quite normal for it to be below 1.0 because we do not include people who are not switching. Some modelers find it easier to always have each row add up to 1.0. If you desire to do this, fill the diagonal with the difference between 1.0 and the sum of the other columns. For example, to do this for product A, replace the top left cell with 1.0 – (0.01 + 0.03 + 0.05 + 0.001) = 0.909 [for you Beatles fans].
![clip_image001[6]](https://blog.iseesystems.com/wp-content/uploads/2009/09/clip_image0016_thumb.gif "clip_image001[6]")